Introduction
CART® (Classification and Regression Trees) is one of the most important tools used in modern Data Mining, Machine Learning and Predictive Analytics. Classification and Regression Trees has revolutionised the field of advanced analytics and inaugurated the current era of Data Science. CART® model can quickly reveal important data relationships, automatically searches for patterns and uncover hidden structure even in highly complex data. CART® can be used to generate accurate and reliable predictive models for a wide range of applications in all types of industry verticals. The most common applications include credit scoring, drug discovery, targeted marketing, fraud detection, financial market modelling, manufacturing quality control, engineering, clinical research, length of patient service, predictive maintenance, etc. CART® supports high-speed deployments to predict in real-time on a larger scale. Moreover, understanding CART® is essential, because it creates the foundation basis for other powerful algorithms like TreeNet® Gradient Boosting, Random Forests® and Multivariate Adaptive Regression Splines (MARS®).
*CART® is a registered trademark of Minitab, LLC.
Origin of CART® (Classification and Regression Trees)
Classification and Regression Tree methodology, also known as the CART® was introduced in 1984 by four world-renowned statisticians (Leo Breiman, Jerome H. Friedman, Richard A. Olshen and Charles J. Stone) at Stanford University and the University of California at Berkeley. When the CART® monograph was first published it revolutionised the emerging field of decision trees in advanced analytics. An entire methodology was introduced for the first time that included multiple tree-growing methods, tree pruning, methods to deal with unbalanced target classes, adapting to the cost of learning and the cost of mistakes, self-testing strategies, and cross-validation. Based on decades of machine learning and statistical research, CART® provides reliable performance and accurate results.
What is CART®?
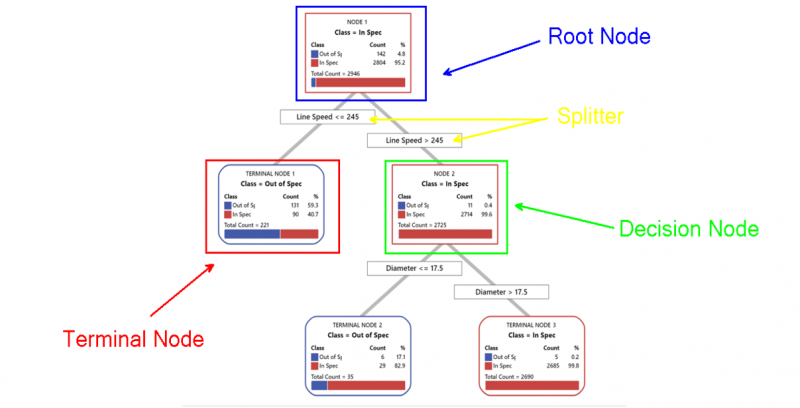
CART® stands for Classification and Regression Trees. CART® is a robust decision-tree tool used for data mining, machine learning and predictive modelling. In order to understand the Classification and Regression Trees better, we need to first know the concept of a decision tree. The decision tree has a tree-like structure with its parent or root node at the top, and use multiple algorithms to splits it in further sub-nodes. The decision tree is known to be a commonly used technique in supervised learning. The goal is to create a model that predicts the value of a target variable based on several input variables whether it can be for categorical or continuous variables. CART® also includes special provisions for handling ordered categorical data and the growing of probability trees.
Decision Tree Basics
Types of Decision Trees
- Classification Tree : Classification Tree is used to create a decision tree for a categorical response (commonly known as target) with many categorical or continuous predictors (factors). The categorical response can be in the form of binomial or multinomial (e.g. Pass/Fail, high, medium & low, etc.). It illustrates important patterns and relationships between a categorical response and important predictors within highly complicated data, without using parametric methods. Also, identify groups in the data with desirable characteristics, and to predict response values for new observations. For e.g., a credit card company can use classification tree to identify customers that will take credit card or not based on several predictors.
- Regression Tree : Regression Tree is used to create a decision tree for a continuous response (commonly known as target) with many categorical or continuous predictors (factors). The continuous response can be in the form of a real number (e.g. piston diameter, blood pressure level, etc.). It also illustrates the important patterns and relationships between a continuous response and predictors within highly complicated data, without using parametric methods. Also, identify groups in the data with desirable characteristics, and to predict response values for new observations. For example, a pharmaceutical company can use regression tree to identify the potential predictors which are affecting the dissolution rate based on several predictors.
Classification and Regression Trees (CART®) in Minitab
*CART® is a registered trademark of Minitab, LLC.
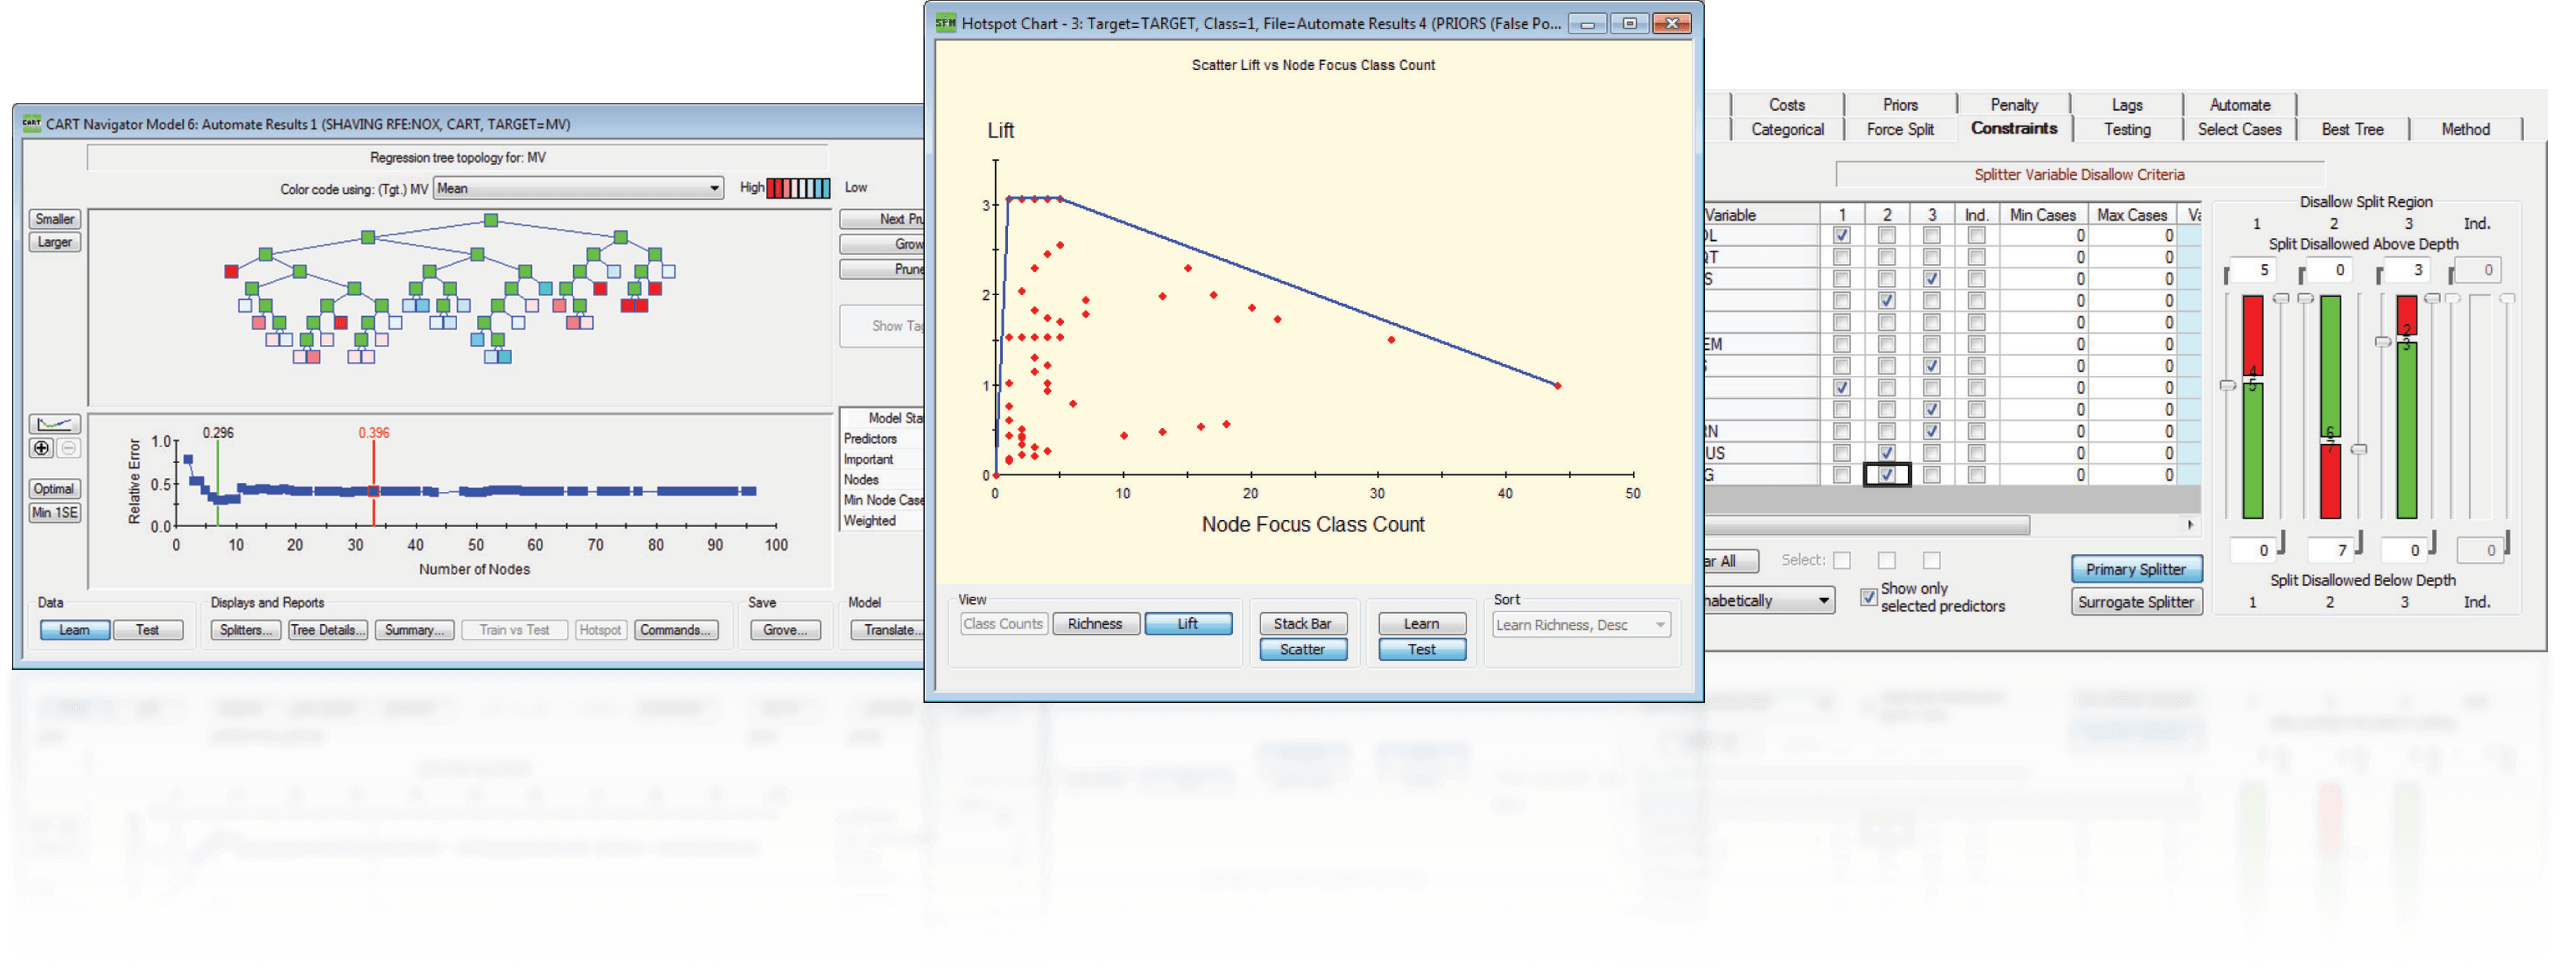
Classification and Regression Trees (CART®) in Salford Predictive Modeler
- Available for all types of response – categorical & continuous.
- Easily handle extreme outliers and many missing values.
- Ideal for large data sets.
- No need to follow any assumptions as it is a non-parametric method.
- The output is simple to understand and interpret.
We conduct various training programs – Statistical Training and Minitab Software Training. Some of the Statistical training certified courses are Predictive Analytics Masterclass, Essential Statistics For Business Analytics, SPC Masterclass, DOE Masterclass, etc. (Basic to Advanced Level). Some of the Minitab software training certified courses are Minitab Essentials, Statistical Tools for Pharmaceuticals, Statistical Quality Analysis & Factorial Designs, etc. (Basic to Advanced Level).
We also provide a wide range of Analytics Solutions like Business Analytics, Digital Process Automation, Enterprise Information Management, Enterprise Decisions Management and Business Consulting Services for Organisations to enhance their decision support systems.