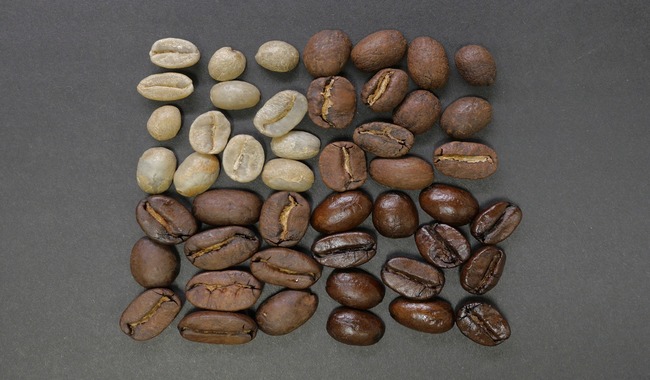
Stratification
Introduction
During a process, there could be variation and we don’t know its source. The variation could be from due to the negligence of personnel, equipment, materials, shift-wise and so on. To understand the problem we divide it into categories or groups in the homogeneous set of data. By doing this it makes easier to understand the data and gives better insights into a process. With this stratified data we can go further to create either the cause and effect diagram or a Pareto chart.

What is Stratification?
Stratification is a method to divide the data into categories or groups (homogeneous kind) and go for further analysis using descriptive, graphical representation or advanced level of statistics. It derives the meaningful information from the data and helps to understand the existing problem. For example, stratification can be done in equipment, materials, location wise, etc.
- Suppose in the food industry, a manufacturer wants to find out whether they are manufacturing good quality products or not. Let say they have 10 different plants located in various parts of India. They will collect samples from different plants and do further analysis. Basically, stratification is a method of collecting the sample and dividing it into strata. Strata should be homogeneous in nature which means it should be of the same type. Here in this example, we have 10 different plants or strata.
- Let us discuss one more example. In a piston manufacturing industry, several defects were found during a process and to analyze the causes of defects they have to stratify the process data. It may occur due to the machine, material, duration, etc. Suppose it occurs due to machine variation and now they have to divide the data into several classes w.r.t machine like Machine A, B and so forth. By doing this they can check the performance of a machine and compare the variation within the machines also.
Important consideration
For doing any type of data analysis, “What is our essential?” and the answer is data. Before collecting data, our aim is to collect a sample which resembles the whole population. There are different ways of collecting samples. In some scenarios, we collect a sample using stratification to have a better representative of a population and do further analysis. For example, we want to reduce variation which is happening due to different methods, machines, material or we want to check which plant is manufacturing a good product. Hence, stratification plays a major role in the quality improvement process.
When to use stratification?
- When we have data which is jumbled all together.
- To divide the data w.r.t common factors and tendencies.
- To identify the source of variation from which categories of data.
- To observe the relationship between two or more subgroups.
Benefits
- We can go for root cause analysis by using stratified samples.
- Identification and control the existing problem.
- It helps in reduction of sampling error.
- Data can be a plot in graphical representation for better understanding.
- Stratification method is applicable in all fields whether it can be manufacturing, service, R&D, quality control, etc. The main aim is to understand the data and eliminate the problem.
Attend our Training Program, to know – “How can we achieve Quality Excellence in an Organisation?” We conduct various training programs – Statistical Training and Minitab Software Training. Some of the Statistical training certified courses are Predictive Analytics Masterclass, Essential Statistics For Business Analytics, SPC Masterclass, DOE Masterclass, etc. (Basic to Advanced Level). Some of the Minitab software training certified courses are Minitab Essentials, Statistical Tools for Pharmaceuticals, Statistical Quality Analysis & Factorial Designs, etc. (Basic to Advanced Level).
We also provide wide-ranging solutions for Enterprise Quality Management to achieve Organisational Excellence.