- Manufacturing
- Apr 08
Understand the Application of ANOVA in Manufacturing Process!

Suppose in the Manufacturing Process, we want to compare and check which are the most reliable procedures, materials, etc. We can use the ANOVA test to compare different suppliers and select the best available.
ANOVA (Analysis of Variance) is used when we have more than two sample groups and determine whether there are any statistically significant differences between the means of two or more independent sample groups. In other words, we can say that it checks the impact of one or more factors by comparing the means of different samples. When we have less than or equal to two sample groups – we go for one sample and two sample tests.

What are the types of ANOVA?
There are two main types of ANOVA viz. one–way ANOVA and two–way ANOVA.
- One Way ANOVA – It is also known as one factor ANOVA. Here, we are using one criterion variable (or called as a factor) and analyze the difference between more than two sample groups. Suppose in glass industry, we want to compare the variation of three batches (glass) for their average weight (factor).
- Two Way ANOVA – Here, we are using two independent variables (factors) and analyze the difference between more than two sample groups. Similarly, we want to compare the variation of three batches of glass w.r.t weight and hardness (two factors).
We have discussed the basic concepts of ANOVA when we have one factor, we use one-way ANOVA and when we have two factors, we use two-way ANOVA. I guess this concept is clear and understandable.
Now, let’s discuss some of the assumptions which we should keep in mind while performing ANOVA.
- Data must be continuous in nature.
- The sample data (variable) should be independent.
- Data should follow a normal distribution.
Example
One Factor ANOVA – In an automobile industry, three quality inspectors (A, B, C) measure the breaking strength of car seat fabric and the management wants to test for a difference between their measurements by comparing means.

- Set the hypotheses
- Null Hypothesis – All means are equal
- Alternative Hypothesis – All means are not equal
- Set the level of significance (α) – 0.05
- We will perform the ANOVA test by using Minitab.
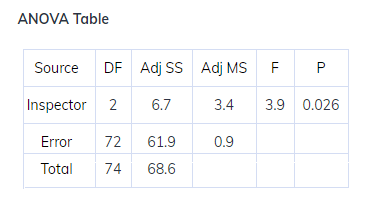
- Conclusion
- Since p-value < alpha value i.e. 0.026<0.05, we reject the null hypothesis and conclude that all means are not equal.
Reference
- Null Hypothesis – It is a type of hypothesis which is presumed to be true i.e. no statistical significance exists in a set of given observations.
- Alternative Hypothesis – It is alternative or contradictory to the null hypothesis. There is a significant difference in the process.
- Level of significance (α) – It represents the probability of making the wrong decision when the null hypothesis is true.
- p-value – It is used in hypothesis testing for making a decision whether to accept or reject the null hypothesis.
Since our null hypothesis is rejected, we need to find out which sample group is different and so we can work for improvement.
Let’s make it clear that
- Null hypothesis is accepted – No further analysis required
- Null hypothesis is rejected – Further analysis is required
Post-ANOVA Analysis
We will use the Tukey test (also known as Honestly significant difference – HSD test). With reference to the above example for one way ANOVA, our null hypothesis was rejected and we will conduct Tukey test by using MINITAB.
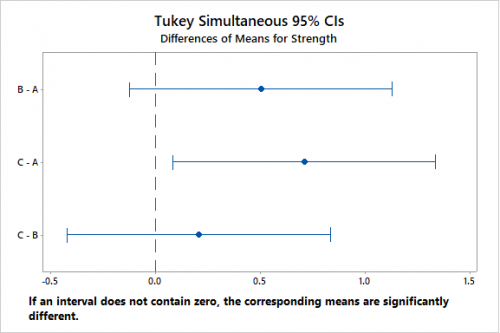
Grouping Information Using the Tukey Method and 95% Confidence
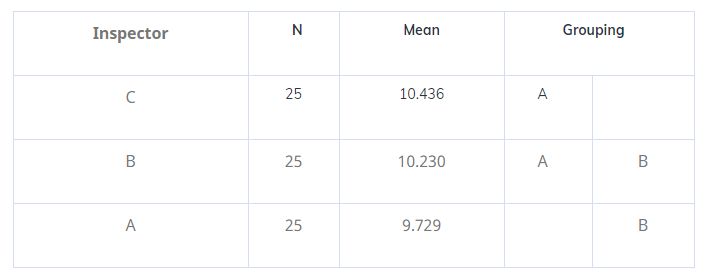
Means that do not share a letter are significantly different.
- Conclusion
- From the above, we can conclude that there is a difference of measurement between the operators A and C. Since their means are not equal, we can work on their improvement process and thus enhance the measurement system.
NB – Want to learn the concepts of ANOVA and Application in Industries? Attend our Statistical Training Program starting from basic to advanced level. Some of the Statistical training certified courses are Predictive Analytics Masterclass, Essential Statistics For Business Analytics, SPC Masterclass, DOE Masterclass, etc. Apart from Statistical training, we also conduct Minitab Certified Training Program, starting from basic to advanced level. Some of the Minitab software training certified courses are Minitab Essentials, Statistical Tools for Pharmaceuticals, Statistical Quality Analysis & Factorial Designs, etc.
We also provide a wide range of Business Analytics Solutions and Business Consulting Services for Organisations to make data-driven decisions and thus enhance their decision support systems.
Related Posts
What can we Discover from the Process Data by Creating a Simple Histogram?
A simple demonstration of Histogram usage in your process! Histogram is commonly used for graphical….
- Oct 05

Is your Sample Size enough for doing the Analysis?
I guess this is an important question we should ask ourselves before doing any kind of analysis. We should…
- Jul 06
Categories
Recent Posts
- What role do t-tests play in Pharmaceutical Processes? When can we apply it?
- How Data Science can help to Improve the present Healthcare Scenarios?
- What can we Discover from the Process Data by Creating a Simple Histogram?
- What are the Quality Tools Available in Minitab?
- Why Choose Minitab as your Statistical Data Analytics Software?
Recent Comments