
Related Posts

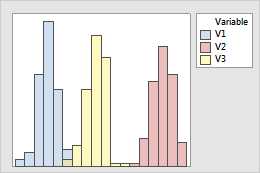
Is your Sample Size enough for doing the Analysis?
I guess this is an important question we should ask ourselves before doing any kind of analysis. We should…
- Jul 06
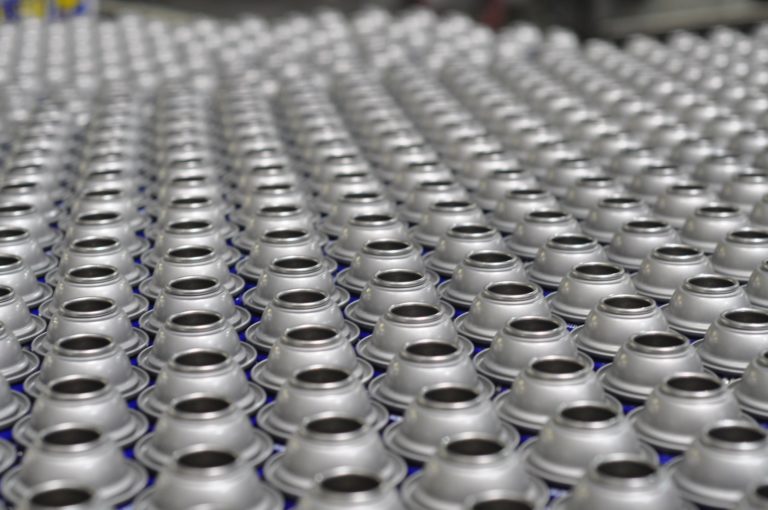
How to Decide whether to Accept or Reject the lot in Manufacturing Scenarios?
Suppose in an organisation, when we have to evaluate the quality of incoming or outgoing products – “How we do it?”
- Jun 07
Recent Comments