Introduction
In all types of the process whether it can be either manufacturing or service industry, we all want to improve the process and to yield the better outputs. Process variation is one of the major drawbacks in quality improvement goals. Sometimes we know there is a variation in a process but we don’t know what the root cause of it. So for this very purpose, we can use the Fishbone diagram and do brainstorming.
Fishbone diagram was introduced by Kaoru Ishikawa to display graphically all the causes occurred during the process variation in a quality improvement plan. This diagram is also known as the Ishikawa diagram.
This diagram looks like a fishbone structure where all the possible causes of a particular problem are being displayed. Basically, it is a tool to explore the causes and to display as many as possible causes that might be creating a problem. So we can do root cause analysis and come with an effective solution.
Types of Fishbone Diagrams
Common purpose to use this diagram is for product design specification and to prevent further quality defects. Here the causes are categorized into various forms and so it will be helpful to identify the source of variation easily.
Some of the common forms are:-
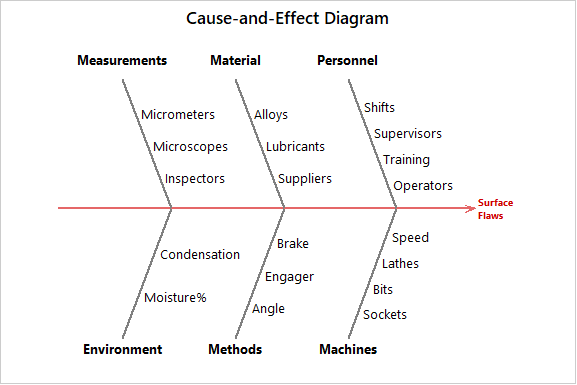
- 6 Ms Use in the manufacturing industry
- Method
- Material
- Manpower (Personnel)
- Measurement
- Mother Nature (Environment)
- Machine
- 4 S. Use in the service industry
- Suppliers
- Systems
- Surrounding
- Skills
This diagram can be used in any type of industry whether it can be manufacturing, service, medical research and so on. We can also customize the categories of causes according to our requirements. It uses brainstorming techniques to know all the possible causes and displays it in the form of a diagram. Then takes corrective action and leads to a robust solution. Some of the common categorization based on industry types was mentioned above.
When to use the Fishbone diagram?
- To identify the root causes of a problem.
- To understand the cause and effect relationship in a process.
- When we need to eliminate root causes in one go.
- For process design and improvisation.
- For better optimization of a process.
Benefits
- The better outlook of a problem and helps to understand it.
- It helps to identify and eliminate the root causes very efficiently.
- Comes with better options for the process improvement goals.
- And it helps to lead a corrective action.
Example
Reference
In a manufacturing plant, a quality inspector wants to find out the causes behind the surface flaws of a product. It resulted in the rejection of products. He creates a fishbone diagram to know the possible causes and to implement the corrective action for it. The common 6 Ms Method has been applied.
Attend our Training Program, to know – “How can we achieve Quality Excellence in an Organisation?” We conduct various training programs – Statistical Training and Minitab Software Training. Some of the Statistical training certified courses are Predictive Analytics Masterclass, Essential Statistics For Business Analytics, SPC Masterclass, DOE Masterclass, etc. (Basic to Advanced Level). Some of the Minitab software training certified courses are Minitab Essentials, Statistical Tools for Pharmaceuticals, Statistical Quality Analysis & Factorial Designs, etc. (Basic to Advanced Level).
We also provide wide-ranging solutions for Enterprise Quality Management to achieve Organisational Excellence.