Introduction
Multivariate Analysis is widely used to analyse data, when there are more than two variables (multiple variables) are involved. It is ideal for large data sets. With Multivariate Analysis we can choose to analyse the covariance structure of the data to understand it, to reduce the data dimension, to assign observations to groups and to explore relationships between the variables. Data can be of various forms like quantitative data, qualitative data, metric data and non-metric data. Some of the widely used Multivariate Analysis Methods are Analysis of Variance (ANOVA), Regression, Survival Analysis, Discriminant Analysis, Factor Analysis, Cluster Analysis, Item Analysis and so forth. Applications of Multivariate Analysis can be found in all the industry verticals, like general manufacturing, pharmaceuticals, healthcare, automotive, banking & finance, etc. We can use this method in quality control, process control, product robustness, predictive maintenance, R&D, business models, market research, etc.
Multivariate Analysis
What is Multivariate Analysis?
Multivariate Analysis is an advanced statistical technique for pattern recognition, examining relationships, developing models and can be used for both qualitative and quantitative data. As it considers multiple variables, it is ideal for a large and complex data set which is common in real-life applications. For most real-world problems we need to use multivariate analysis to model the relationship to the response. There are two categories of multivariate techniques, according to its relationship – dependence and independence. For dependence type, we can use regression, survival analysis, discriminant analysis, etc. For independence type, we can use factor analysis, cluster analysis, correspondence analysis, etc.
Multivariate Analysis Methods
- Principal Components Analysis (PCA) – Principal Components Analysis is used to avoid multicollinearity or to reduce the number of predictors relative to the number of observations. PCA can be used to identify a Principal Components (a smaller number of uncorrelated variables) from a large set of data. The main objective of principal components analysis is to explain the maximum amount of variance with the fewest number of principal components. We can use PCA before fitting the Regression Model, in order to avoid multicollinearity. To ensure that PCA results are valid, we should have at least two variables and measurements for each variable should be recorded in separate numeric columns.
Factor Analysis – Factor Analysis is a method used to summarises data into a few dimensions by condensing a large number of variables into a smaller set of latent factors (underlying factors). It helps in data interpretations by reducing the number of variables. Use factor analysis to assess the structure of your data by evaluating the correlations between variables. We can use factor analysis for large data sets. To ensure that the factor analysis results are valid, we need to have at least two variables and measurements for each variable should be recorded in separate numeric columns. For the analysis results to be useful, groups of variables should be highly correlated, with small correlations among variables from different groups.
Item Analysis – Item Analysis is used to evaluate tests based on the characteristic of individual items or entire items sets. The objective of item analysis is to assess how consistently multiple items in a test measure the same characteristic. Using item analysis, we can assess the strength and direction of the relationship between pairs of items. We can also evaluate the overall internal consistency of the test and determine whether omitting items improve internal consistency. Internal consistency estimates how well the test items are actually measuring the original or valid measurements. There are a variety of internal consistency measures. A high degree of internal consistency indicates that items are giving similar measurement. To ensure that the factor analysis results are valid, we need to have at least two variables and the items should measure the same characteristic.
Cluster Analysis – Cluster Analysis or clustering is used to group variables into a cluster that share common characteristics (homogeneous in nature). There are different methods of clustering. Cluster analysis methods follow both hierarchical and non-hierarchical procedures. Both cluster observations and cluster variables use a hierarchical procedure to form the groups or clusters. We can also display a dendrogram (tree diagram) to visualise the clustering results at each step. Cluster K-means uses a non-hierarchical procedure to group observations. In data science, we can find many applications of cluster analysis.
Discriminant Analysis – Discriminant Analysis is used to classify observations into two or more groups and determine how accurately the observations are classified into the known groups. We can evaluate how well the predictor variables differentiate the groups and also predict the groups for observations that have unknown groups. Discriminant analysis is classified into Linear and Quadratic discriminant analysis. Use a linear analysis when we assume the covariance matrices are equal for all groups. Use a quadratic analysis when we assume the covariance matrices are not equal for all groups. To ensure that the factor analysis results are valid, predictor variables should be quantitative, predictors should not be highly correlated, response variable should indicate the group and data for the predictor variables should be normal for each group.
Correspondence Analysis – Correspondence Analysis explores the relationships of the variables based on the types of contingency tables. This procedure decomposes a contingency table in a manner similar to how principal components analysis decomposes multivariate continuous data. Correspondence Analysis is classified into Simple Correspondence Analysis and Multiple Correspondence Analysis. Use Simple Correspondence Analysis to explore relationships in a two-way classification. Use Multiple Correspondence Analysis to explore the relationships of three or more categorical variables.
Multivariate Analysis in Minitab
Minitab is a Data Analytics Software, where we can predict, visualize, analyse and harness the power of data. Dive deep into the data, forecast your business to make better decisions, reduce costs and stop mistakes before it happens. Identify the significant factors which are affecting your process and uncover the hidden relationship between variables. Business Analytics tools are also available to ease you in your toughest business problems. Minitab applications can be found in various processes like automotive, healthcare, energy, agriculture, pharmaceuticals, marketing, telecom, etc.
Multivariate Analysis in Minitab
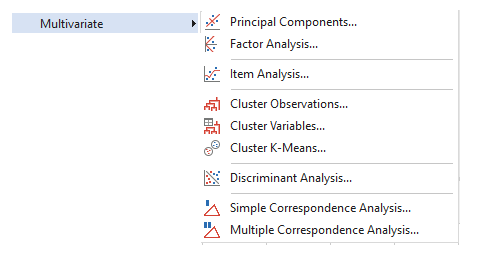
Multivariate Analysis in Minitab, we can analyse data when you have made multiple measurements on items or subjects. We can do different methods of Multivariate Analysis in Minitab such as Principal Components Analysis, Factor Analysis, Item Analysis, Cluster Analysis, Discriminant Analysis and Correspondence Analysis. Various organisations are using Minitab software for multivariate analysis purpose.
Try Multivariate Analysis in Minitab, download Minitab free trial.
Attend our Training Program, to know more about Statistics and Statistical Software. We conduct various training programs – Statistical Training and Minitab Software Training. Some of the Statistical training certified courses are Predictive Analytics Masterclass, Essential Statistics For Business Analytics, SPC Masterclass, DOE Masterclass, etc. (Basic to Advanced Level). Some of the Minitab software training certified courses are Minitab Essentials, Statistical Tools for Pharmaceuticals, Statistical Quality Analysis & Factorial Designs, etc. (Basic to Advanced Level).
We also provide a wide range of Business Analytics Solutions and Business Consulting Services for Organisations to make data-driven decisions and thus enhance their decision support systems.