Before going to the types of regression analysis, let us first understand the basic of Regression Equation. The relationship between variables in a regression analysis is expressed by an equation known as regression equation.
Now, let’s discuss the types of regression
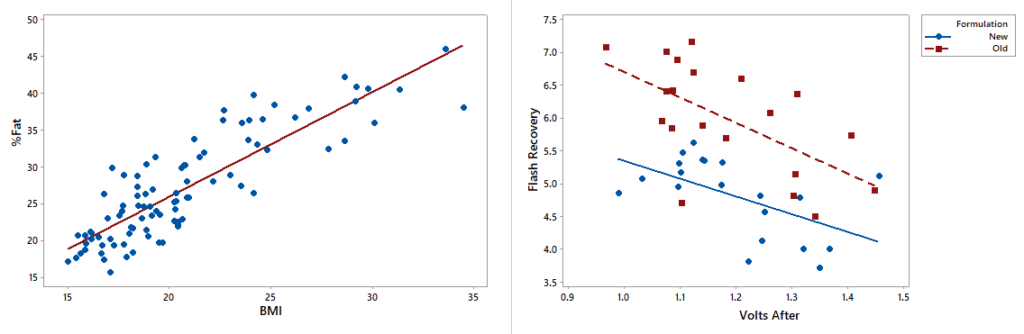
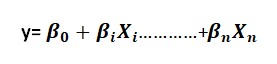
- Simple Linear regression – It is used to study the linear relationship between one independent and one dependent variable. This analysis assumes that there is a linear association between the two variables. Regression equation is given by
![]() where,
where,
- x – Independent variable
- y – Dependent variable
- βo – y intercept point
- β1 – Slope of the line (Regression coefficient)
- Multiple Linear regressions – It is used to study the linear relationship between one dependent variable and more than two independent variables. This analysis assumes that there is a linear association between the variables. Regression equation is given by
where,
- 𝑿𝒊 𝑡𝑜 𝑿𝒏 – independent variable
- y – Dependent variable
- βo – y Intercept point
- β1 – Regression coefficient of variable 𝒙𝟏
- 𝛽2 – Regression coefficient of variable 𝒙𝟐
Reference –
- Independent variable (x) – Also known as a predictor or explanatory variables. It is used to predict or to explain the behaviour of the dependent variable.
- Dependent variable (y) – Also known as Response or Output variable. This is the variable that we are trying to understand or predict and depends on the values of independent variables.
Suppose in an automobile manufacturing industry, let us check the relationship between weight and mileage of a cars
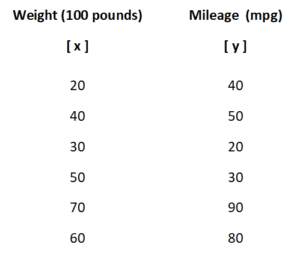
Here,
- x – Independent variable & y – Dependent variable
- First, we will fit the data in a scatterplot with regression line to check whether it is a linear or nonlinear regression equation.
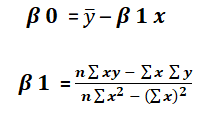
- Then equate on a Regression Equation
![]()
where,
- After equating all the values on a Regression equation,
![]()
- From the resultant equation, we can predict the value of Y based on x as x is an independent variable.
With reference to above example, we will add one more independent variable i.e. fuel capacity
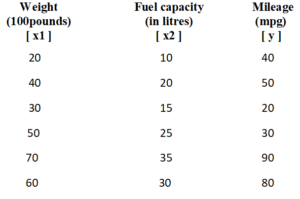
Here,
- x1 & x2 – Independent variables & y – Dependent variable
- First, we will fit the data in a scatterplot matrix with regression line to check whether it is a linear or nonlinear regression equation.
- Then equate on a Regression Equation
![]()
where,
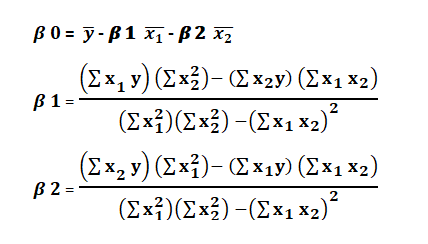
- After equating all the values on a Regression equation,
![]()
- From the resultant equation, we can predict the value of y based on x1 & x2 (independent variables).