Hypothesis Testing

Introduction

In any process scenarios – either manufacturing or service, we collect sample from a large set of data (population) for analysis and draw inferences. To determine whether the results are statistically significant or not – “We use Hypothesis Testing”. In simpler words, the process of drawing inferences (making decisions) about the sample with regards to population as a whole.

For example, manufacturer wants to check the product’s quality meets the pre-specified criteria. Here, it is not possible to check the whole population to make a decision. We collect a sample data from the population. Based on the sample data, we need to make an inference for a population – This process is called as “Hypothesis Testing”. It is basically an assumption that we make about the population parameter.

Hypothesis_Testing

Basic Terminology

      • Sampling – It is a procedure of selecting a sample from a large set of data (Population). For e.g. a manufacturer industry wants to check the quality of a product. It is not possible to check on each and every item it manufactured. So we will take some part of it for inspecting the quality.
      • Null Hypothesis (H0) – It is a type of hypothesis which is presumed to be true i.e. no statistical significance exists in a set of given observations. In simpler words, everything is okay and the process is fine. For e.g. quality inspector is sure that product is good and has no defects.
      • Alternative Hypothesis (H1) – It is alternative or contradictory to null hypothesis. There is a significant difference in a process. In simpler words, everything is not okay and the process is bad. For e.g. product is bad and has defects.
      • Level of significance (α) – It represents the probability of making wrong decision when the null hypothesis is true. The common alpha values are 1% (0.01), 5% (0.05) and 10% (0.1). An alpha value of 0.05 indicates that we are willing to accept a 5% chance that we are wrong when we reject the null hypothesis. To lower this risk, we must use a lower value for α.
      • p value – It is a probability value and is calculated using the test statistic. It is used in hypothesis testing for making decision whether to accept or reject the null hypothesis. In simpler words, to determine the significance of a results and is compared to the level of significance. It lies between 0 and 1.

Procedure for Hypothesis Testing

  1. State the hypotheses – In Hypothesis testing, there are two types of hypotheses i.e. null and alternative. These are based on assumptions about the population. Null hypothesis is denoted by and alternative hypothesis is denoted by. For e.g. quality inspector wants to check whether the manufactured products are good or has defects. Here,
      • Null hypothesis (H0) – The products are good and has no defects.
      • Alternative hypothesis (H1) – The products are bad and has defects.
  2. Set the criteria for decision – To set the criteria for decision, we set a level of significance (α). It represents the probability of making wrong decision when the null hypothesis is true. The common alpha values are 1% (0.01), 5% (0.05) and 10% (0.1).
  3. Compute the test statistic – A test statistic is a random variable that is calculated from sample data and used in a hypothesis test. We compute test statistic based on hypothesis tests we perform. It can be z test, t test, F test, Chi-square and so on. For these tests, test statistic are called as Z statistic (or Z score), t statistic (t Score), F statistic and chi square statistic. We use test statistic to determine whether to accept or reject the null hypothesis. The test statistic compares data with what is expected under the null hypothesis.
  4. Calculate p value – It is a probability value and is calculated using the test statistic. It is used in hypothesis testing for making decision whether to accept or reject the null hypothesis. In simpler words, to determine the significance of a results and is compared to the level of significance. It lies between 0 and 1.
  5. Make a decision (Drawing inferences) – On this stage, we draw inference based on calculated p value and level of significance (α). We compare Check out below the decision criteria
      • p value < α -> Reject null hypothesis
      • p value > α -> Accept null hypothesis

For e.g. when the p value is less than 0.05 (alpha value), we reject the null hypothesis and accept the alternative hypothesis. When the p value is greater than 0.05, we accept the null hypothesis and reject the alternative hypothesis.

Before doing an analysis of data, we often have questions like – “How much data is needed and how reliable our collected data is?”
To understand this concept, Check our blogs

While making conclusion in a hypothesis testing, there is always a possibility to occur errors – known as type I and type II errors. Since the test is based on probabilities, there is always a chance of making an incorrect conclusion. 

      • Type I error – We reject the null hypothesis when it is true. Then we commit a type I error. The probability of making the wrong decision when the null hypothesis is true is known as α (level of significance).
      • Type II error – We accept the null hypothesis when it is false. Then we commit a type II error. The probability of accepting the null hypothesis when it is false is known as β.

Suppose in a cosmetic manufacturing industry, when the UV level of sun screen is at the appropriate level – they reject the lot (Type I error). And when the UV level of sun screen is not at the appropriate level – they accept the lot (Type II error).

Let us have a brief overview; in real life manufacturing or service processes, we first do sampling (to collect samples) because it is not always possible to do analysis on whole data (population). Suppose in a beverage manufacturing industry, they produce lakhs of bottle cans – it is time consuming to measure the quality dimensions of whole outputs and in such cases we apply sampling to collect samples. Here, we do not know the population standard deviation and hence we have to use t test.

The commonly used sample test methods are

      • One sample t test – We use one sample t test when we have one sample group. By doing so, we would be able to find whether the mean is significantly different or not with regards to our target specification.

For e.g. in a pharmaceutical company, QA officer collects a samples of 10 tablets to measure the dissolution rate of a drug. Here, we can find whether the mean of a dissolution rate is significant to our target dissolution rate or not.

      • Two sample t test – We use two sample t test when we have two independent sample groups. By doing so, we would be able to find whether the means are significantly different or not with regards to our target specification. And we would be able to compare which one is good.

For e.g. in a pharmaceutical company, QA officer collects a two sample groups (A and B) each of 10 tablets to measure the dissolution rate of a drug. We can compare which of these types have a better dissolution rate and hence we able to choose the best one.

By now we know the basic concepts of sample tests, when we have one sample we use one sample t – test and when we have two samples we use two sample t – test. In many scenarios, we will have more than two sample groups say three or four sample groups then “What can we do?” We can go for ANOVA test. Here, we can use more than two sample groups for analysis.

To discover the importance of t-tests and ANOVA, check our blogs 

Suppose in a beverage manufacturing company, a quality inspector wants to know whether the bottle caps diameters are equal to 3 cm or not. If the bottle caps diameters are not equal to 3 cm then it won’t fit during the filling process.

(One sample t-test)

  1. The first step is to do sampling. We collected a sample of 50 bottles (n=50) and measured the diameters of all the bottles.
  2. Based on the measurement, we got mean (ȳ)=3.3 and standard deviation (s)=1.3
  3. Now state the hypotheses –
      • Null hypothesis (H0) = the bottle diameter is equal to 3 cm.
      • Alternative hypothesis (H1) = the bottle diameter is not equal to 3 cm.
  4. We set the level of significance (α) as 0.05 (5%).
  5. Compute the test statistic – we will apply t- statistic (since population standard deviation is unknown).t-statistic
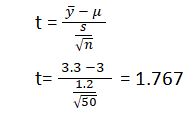
  6. Now say p value = 0.023 (based on test statistic)
  7. Making conclusion –

Since we know,

      • p value < α, Reject Null Hypothesis
      • p value > α, Accept Null Hypothesis

Here, p value < alpha value (i.e. 0.023 < 0.05) and hence we reject the null hypothesis. Therefore the bottle diameter is not equal to 3 cm.

Attend our Training Program, to know more about Statistics and Statistical Software. We conduct various training programs – Statistical Training and Minitab Software Training. Some of the Statistical training certified courses are Predictive Analytics Masterclass, Essential Statistics For Business Analytics, SPC Masterclass, DOE Masterclass, etc. (Basic to Advanced Level). Some of the Minitab software training certified courses are Minitab Essentials, Statistical Tools for Pharmaceuticals, Statistical Quality Analysis & Factorial Designs, etc. (Basic to Advanced Level).

We also provide a wide range of Business Analytics Solutions and Business Consulting Services for Organisations to make data-driven decisions and thus enhance their decision support systems.