- Minitab
- Jul 08
How to Improve Manufacturing Quality by using Minitab?

Quality is the common terminology which has become one of the most important customer decision factors and thus controlling and improving quality has become the topmost priority in an organisation. For an organisation to sustain in today’s competitive world, it should deliver quality consistently.
Quality can be generally defined as a “fitness for intended use”. As per the manufacturing perspective, to manufacture products based on the quality of conformance (design specifications). Manufacturing covers a wide range of areas like aviation, automobiles, pharmaceutical, electronics, food & beverages, chemical, glass and so on. As we all know that manufacturing quality is a continuous improvement process and every one of an organisation, starting from ground level to a higher level, has to contribute their knowledge & experience to achieve the highest level of quality.

Before moving to the main agenda of this blog, let’s discuss a bit about MINITAB.
What is Minitab?
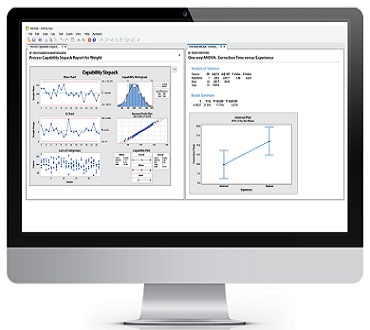
Minitab is a data analytics software which delivers statistical analysis, visualizations, predictive and improvement analytics to enable data-driven decision making. Regardless of statistical background and programming skills, organisations can use Minitab to analyse small and large datasets for quality improvement, process validation, product development and so forth.

Minitab - Powerful statistical software everyone can use
Now, we will discuss,
How can we improve our Manufacturing Quality by using Minitab?
As customer expectations have risen over time, it is a challenge for every organisation to improve customer satisfaction, keep manufacturing costs to a minimum, reduce defects and improve quality. To overcome these challenges and improve our Manufacturing Quality, we can use Minitab.
Following are some of the statistical data analytics tools available in Minitab, which helps to improve Manufacturing Quality: –
- Power & Sample Size
Before doing analysis, we should know the sample size required to do the analysis. If we collect more samples than required, it will waste our resources and if we collect fewer samples than our results might lack accuracy. So, to collect optimum samples required, we apply the concept of “Power & Sample Size”.
***** To Know more about the concept of “Power & Sample Size”, You can read our blog titled “Is your Sample Size enough for doing the Analysis?” *****
- Measurement System Analysis
During data collection, how much we are sure that the data we have collected is reliable enough for doing analysis! In manufacturing scenarios, we collect measurement data from various sources and the device measuring the host should produce reliable results. Measurement system analysis (MSA) helps us to detect variation in a measurement system and are used to collect reliable data. For your kind note, it is a prerequisite for successfully implementing lean, six sigma and lean six sigma projects.
- Graphical Analysis
When we plot data in the form of graphs or diagrams, it gives an overall view of a process data in a simper visual form and easy to understand. Some of the popular graphical analysis tools available in Minitab are bar chart, histogram, boxplot, Pareto chart, scatterplot, control chart, etc.
- ANOVA
ANOVA or Analysis of Variance helps us to choose the best process methods, reliable suppliers, compare different groups and so on. It is used when we have more than two independent sample groups. It compares the significant differences between the means.
***** To Know more about ANOVA, You can read our blog titled “Understand the application of ANOVA in Manufacturing Process!” *****
- Process Capability Analysis
In the manufacturing industry, we often required information about process performance or capability. So, we can make decisions with regards to customer requirements. Process capability refers to the capability of a process to meet customer requirements consistently. It is one of the primary tools in Statistical Process Control.
- Design of Experiments
In manufacturing scenarios, product design & formulation plays an important role and getting an optimum response is always a headache. Design of experiment helps us to understand the process parameters influence the settings and identify the reasons for the changes. Thus, it provides a quick medium to understand and optimize products and processes.
We have discussed a few of the statistical data analytics tools available in Minitab. Applying these tools in a proper sequence, you can achieve the highest level of quality for your manufacturing processes.
Note – With Recent Release, Minitab now Available on both Desktop and the Cloud. Python Integration in Minitab. We can run Python scripts easily in Minitab and extend our analytical capabilities by collaborating with the Data Analyst, Data Engineer, Machine Learning Engineer and the Data Science Generalist.
Attend our training program to gain exposure to a broad range of statistical tools and assess it in your process for Improving Service Quality. Attend our Minitab Certified Training Program, starting from basic to advanced level. Some of the Minitab software training certified courses are Minitab Essentials, Statistical Tools for Pharmaceuticals, Statistical Quality Analysis & Factorial Designs, etc. Apart from Minitab training, we also conduct basic and advanced Statistical training. Some of the Statistical training certified courses are Predictive Analytics Masterclass, Essential Statistics For Business Analytics, SPC Masterclass, DOE Masterclass, etc.
We also provide wide-ranging solutions for Enterprise Quality Management to achieve Organisational Excellence.
Related Posts

What are the Quality Tools Available in Minitab?
The term Quality generally defined as “fitness for intended use”. It plays an important role in organisational excellence. Improving quality has…
- Oct 05

Why Choose Minitab as your Statistical Data Analytics Software?
Since we are living in a data-driven society, where data analytics have taken centre stage in recent years. Data…
- Aug 06
Categories
Recent Posts
- What role do t-tests play in Pharmaceutical Processes? When can we apply it?
- How Data Science can help to Improve the present Healthcare Scenarios?
- What can we Discover from the Process Data by Creating a Simple Histogram?
- What are the Quality Tools Available in Minitab?
- Why Choose Minitab as your Statistical Data Analytics Software?
Recent Comments