Measurement System Analysis (MSA)
Introduction
We are living in a data-driven society, where data are produced and required for analysis in every scenario. It can be either in manufacturing or service industries. Some of the examples are automobiles, pharmaceuticals, garment, healthcare, airlines, banks, consulting firms, etc. MSA helps us to find variation due to measurement system itself and guide us to improve the system for measurement.
Suppose in a shaft manufacturing company, operators use callipers to measure the diameter of the shaft. This measurement data is being used to see the process overall view and further to check whether the process is good or bad. Now in this circumstance, “Are we 100 % sure that the collected data is measured correctly or not?” “If there is a variation in the measurement system then what is the consequences?” We might make an incorrect decision which will hamper our system processes and results in a huge loss in every aspect. A measurement system analysis is a critical component for any quality improvement process. So it is always the first priority to evaluate measurement system before using control charts, capability analysis, or other analyses, to prove that the measurement system of the process is accurate and precise. And hence we can clarify that the data are reliable for making a decision.

What is Measurement System Analysis?
Measurement system analysis is a method to determine whether the measurement system is acceptable or not. It helps us to detect the amount of variation exists within a measurement system. Use measurement system analyses to determine the amount of total variation that is from the measurement system and to analyses to evaluate the consistency and accuracy of operators.
Data are collected for some sort of measurement system. A Measurement System is a collection of measurement devices, measurement procedures and operators that are used to obtain a measurement. Before collecting data we should know which type of data we are dealing with. So it would be easier for us to use the rightful method for analysis.
- For continuous data – When data collected are in the form of fractional or decimal value. For e.g. weight, length, time, temperature, etc. In such a scenario we use Gage R & R analysis.
- For Attribute data – When data collected are in the form of count or categorized in the form of group. For e.g. accept or reject, good or bad, and so on. In such a scenario we use Attribute agreement analysis.
It can be classified into the following two categories.
1.Accuracy – It depicts the difference between the measurement of a part and its actual value.
- Bias – It is the measurement difference between the observed value and true value.
- Linearity – It is the difference or a change in bias value w.r.t its size.
- Stability – It is a measurement how well the system performs over time or we can say, it is a change in bias value over time.
2.Precision – It depicts the closeness between the measured value and the true value.
- Repeatability – It is a variation which occurs when the same operator measures the same part with the same device.
- Reproducibility – It is a variation which occurs when the different operators measures the same part with the same device.
- Gage R & R Analysis – Usually known as Gage Repeatability & Reproducibility. It is used for the continuous type of data. It helps us to examine repeatability and reproducibility. It examines whether the inspectors are consistent in their measurements of the same part (repeatability) and whether the variation between inspectors is consistent (reproducibility).
Under this analysis, it is classified into the following types –
- Crossed gage R&R study – This study is used when we have crossed factors. Two factors are crossed when each level of one factor occurs in combination with each level of the other factor. Here, each operator measures each part and the same parts are measured by each operator multiple times.
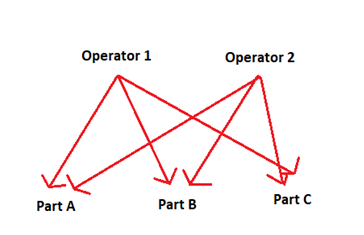
Crossed gage R&R study - Nested gage R&R study – This study is used when we have nested factors. Two factors are nested when the levels of one factor are similar but not identical, and each occurs in combination with different levels of another factor. Here, each part is measured by only one operator.
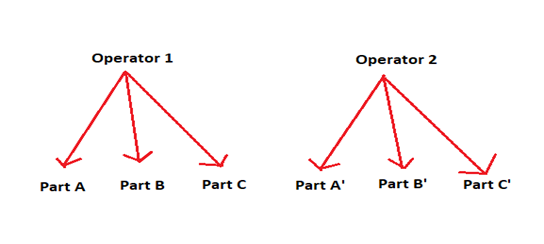
Nested gage R&R study
- Crossed gage R&R study – This study is used when we have crossed factors. Two factors are crossed when each level of one factor occurs in combination with each level of the other factor. Here, each operator measures each part and the same parts are measured by each operator multiple times.
- Attribute agreement analysis – Also called as Attribute gage R & R study. This type of study is applicable in attribute data. It is used to determine the accuracy of assessments made by operators and to detect which items have the large occurrences of misclassification rates. For example, a quality engineer wants to assess the consistency and correctness of the operators’ ratings who rate the print quality of the cotton fabric.
- Expanded gage R&R study – The above two methods deals only with the two factors i.e. parts and operators. We will use Expanded gage R&R study when we have
- More than two factors
- Incomplete or unbalanced data
- Both crossed and nested designs.
We can analyze data by applying the following analysis techniques –
- ANOVA – It is a general method in Gage study to find the variation in a measurement system. Here we can detect the variation either due to the operator or to locate the portion in the measurement process. It determines which of the variables/factors have a statistically significant impact on the process measurement system. In ANOVA, we can determine reproducibility, repeatability and the most important is to understand the interaction effect in a system. The variation in a measurement system can be by parts, operators, the interaction between parts and operators, etc.
- X Bar/ R Charts – It is often used in a measurement system to visually display the data. It consists of plotted points, centre line and control limits. The X bar chart compares the part-to-part variation to the repeatability component. The R Chart is usually used to check the operator consistency. Here, if any points lie above or below the control limits then the operator is not performing well. This method lacks behind the ANOVA method as it cannot calculate the variation due to the interaction effect.
To analyze data in attribute agreement, following procedures to be followed.
- Assessment agreement – Here we can find the details like operators name, total number of items evaluated, no of times that the operator ratings agree and percentage of operator agreement. It also provides 95 % confidence interval values for the percentage of operator ratings that match each other or with the standard value.
- Kappa Statistics – We used kappa statistics to measure the degree of agreement of ratings made by multiple operators for the same samples. It gives us an alternative measure for assessing how well the operators agree with themselves, the standard and each other. Its values range from 0 to 1.
- Kendall’s coefficients – Calculate Kendall’s coefficients to know the association between the operators → when ratings are ordinal and there is 3 or more level of ratings. Its values range from 0 to 1.
- Before the collection of data from a process – to analyze process control or capability.
- To confirm that the measurement system measures consistently and accurately.
- To examine whether the measurement system is stable over time.
- To evaluate a measurement system before using it to monitor or improve a process.
As reference to AIAG guidelines, the following acceptance criteria are being followed in MSA.
For Gage R&R analysis – When %Tolerance / % Study Variation is
- Less than 10 % – The measurement system is excellent and can be used to collect data.
- Between 10 to 30 % – Acceptable depending on the process factors like device costs, repair cost and so on.
- More than 30 % – The measurement system is not acceptable.
For Attribute Agreement analysis – Kappa values range from -1 to +1. When a Kappa value
- Kappa=1, perfect agreement exists.
- Kappa=0, the agreement is the same as to random chance.
- Kappa<0, the agreement is weaker.
The AIAG suggests that kappa value should be greater than 0.75 (within operator, between operators, each operator to standard and all operators to standard) for a good agreement. However, larger value kappa=0.90 are preferred.
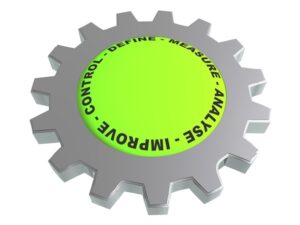 Measurement System Analysis is applicable in many methodologies which we have been using since its inception. Some of them are discussed below.
- DMAIC – It is a well-known Six Sigma methodology and focused on improving the process. DMAIC stands for Define Measure Analyze Improve and Control. Measurement system analysis is the initial stage in the Measure phase of a six sigma project. It is a statistical method to determine whether the measurement system is acceptable or not for decision making. It helps us to detect the amount of variation exists within a measurement system and ensure that the collected data is consistent, reliable and unbiased.
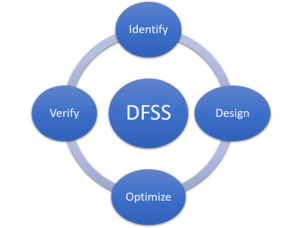
- DFSS – Design for Six Sigma (DFSS) is an improvement method for product design and process performance at six sigma quality levels (New product development). Traditional six sigma project use DMAIC. And DFSS (business oriented) use DMADV methodology for designing the product or service from the base level. DMADV stands for Define Measure Analyze Design and Verify. Measurement system analysis is the first step in the Measure phase of a DFSS project.
It is a prerequisite for successfully implementing lean manufacturing, six sigma and Lean Six Sigma projects. It is also useful in the implementation of SPC, DOE and quality improvement processes.
- Before going further on decision making regarding your process, it is always the topmost priority to collect the data which are measured precisely and accurately. You should be confident enough to trust the collected data. And hence leads to better decision making.
- It gives the better reliability of the measurement system in a statistical way.
- With the collected data, we can do SPC (Statistical Process Control), DOE (Design of Experiment) and other techniques to emphasize their true potential on the improvement of quality product and productivity.
- It leads to successful implementation of lean-six sigma and TQM (Total Quality Management) Practices.
Measurement system analysis is a method to determine whether the measurement system is adequate or not for taking measurements. A Measurement System consists of gauge, part and operator that are used to obtain a measurement. Without reliable measurements, we cannot achieve quality control and assurance.
MSA has been applied successfully both in discrete manufacturing (Automobiles, Defense, Aerospace, etc.) and process manufacturing (Glass, Pharmaceutical, Beverage, etc.) industries. With proper implementation of MSA we will be able to conduct Statistical process control (SPC), Design of Experiment (DOE), etc. successfully and achieve process stability to continuous improvements in product quality and so forth.
But in recent years, MSA has been implemented in various service sectors (Healthcare, financial institutions, call centres, etc.) along with SPC and DOE. Service industry plays an important aspect of our life. They offer services which are needful to us – like hospitals, airlines, banks, etc. Suppose during the initial clinical trial phase of a particular medicine, “If the data are not taken properly?” And move forward for further analysis. Then “What would be consequences of it?” Obviously, it may fail later on final phases. Moreover leads to a huge loss in terms of resources like money, time and so on. Therefore device measuring the host condition should produce consistent and reproducible results.
For example, Mr. Ram went to a clinic to check his blood pressure level. And the blood pressure level was found to be 140. He was not sure whether the blood pressure level was accurate. So he requested the doctor to check his blood pressure level again. Then the doctor simultaneously measured his blood pressure level and found it to be 110 & 120.
As we can see the measurement device are giving different outputs. In measurement system – the three factors which data rely on are gauge (i.e. sphygmomanometer), part (i.e. patient) and operator (i.e. doctor). Here, “Why sphygmomanometer is giving different measurements?” It could be due to some problem in a measurement device. “Maybe at that time his blood pressure level was high & low?” Or else the doctor is not measuring properly.
To overcome this problem, we can use measurement system analysis and find the solution.
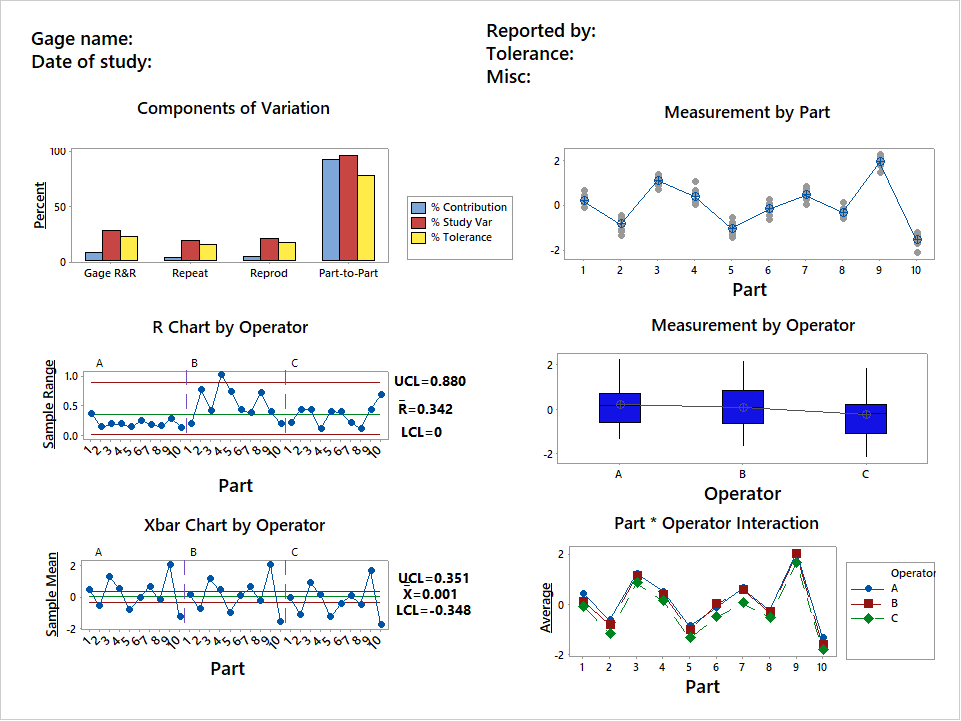
In a manufacturing industry, an engineer selects 10 parts that represent the expected range of the process variation. Three operators measure the 10 parts, three times per part, in a random order. By using MINITAB, he performs a crossed gage R&R study to assess the variability in measurements that may be from the measurement system.
Results
- In Components of Variation graph, the %Contribution from Part-To-Part > Total Gage R&R. Thus, much of the variation is due to differences between parts.
- The R Chart by Operator shows that Operator B measures parts inconsistently.
- In the X bar Chart by Operator, most of the points are outside the control limits. Thus, much of the variation is due to differences between parts.
- The By Part graph shows that the differences between parts are large.
- In the By Operator graph, the differences between operators are smaller than the differences between parts, but are significant (p-value = 0.00). Operator C’s measurements are slightly lower than the measurements of the other operators.
- In the Operator* Part Interaction graph, the lines are approximately parallel and the p-value for the Operator*Part interaction found in the table is 0.974. These results indicate that no significant interaction between each Part and Operator exists.
Attend our Training Program, to know more about Statistics and Statistical Software. We conduct various training programs – Statistical Training and Minitab Software Training. Some of the Statistical training certified courses are Predictive Analytics Masterclass, Essential Statistics For Business Analytics, SPC Masterclass, DOE Masterclass, etc. (Basic to Advanced Level). Some of the Minitab software training certified courses are Minitab Essentials, Statistical Tools for Pharmaceuticals, Statistical Quality Analysis & Factorial Designs, etc. (Basic to Advanced Level).
We also provide a wide range of Business Analytics Solutions and Business Consulting Services for Organisations to make data-driven decisions and thus enhance their decision support systems.