Let’s first discuss the origin of sigma (σ) – It was introduced by Carl Friedrich Gauss during the nineteenth century as a measurement of the shape of a bell curve (Normal Distribution Curve) and gives information about the flatness of a curve. σ is known as a standard deviation, which means “How much variability exists in a process?”
Later during the 1920s, Walter Shewhart introduced the “3σ” approach to show variability in a process with the help of Control Charts. He found that the variation in a process occurred either from a random (Common) or non-random (Special) causes.
Six – Sigma was first introduced in 1980 at Motorola by Bill Smith and Dr Mikel Harry. It was used to reduce the number of defects to 3.4 units/every one million units. It was highly inspired from previous quality improvement approaches like “Ford’s Assembly Line”, “Toyota Production System (TPS)” and so forth. They worked together to come up with “DMAIC” – which became the key concept to the implementation of successful Six Sigma projects. Later quality measurement standards like Cp, Cpk and zero defects were introduced. Within 2 years of the introduction of Six Sigma, Motorola won the first Malcolm Baldrige National Quality Award.
After Motorola’s success in six-sigma, many organizations like Allied Signal, General Electric, etc. started adopting six sigma approaches.
Six Sigma is implemented in industry to detect a process variation and to reduce it for better quality assurance. By monitoring the performance of a process, we can detect trends or changes in the process before they produce non – conforming product and scrap.
[By reducing variation]
Variation can be divided as common cause variation and special cause variation.
- Chance causes are also known as random or natural or common causes. It is due to the natural variation of the process; i.e. Variation due to the way the process was designed and we cannot identify. For example, the fuel efficiency of machine varies slightly; the diameter of a bottle cap varies slightly and so on. (Statistically in control)
- Assignable causes are also known as special or non-random or unnatural causes. Causes can be identified and reduced – poor employee training, equipment nonfunctional, etc. An example of special cause variation is the variation that might result if someone untrained is allowed to work in the process. (Out of control)
DMAIC – It consists of five phases in order.
- Define – This is the initial phase of DMAIC methodology. Here we need to define our goal and objectives as per the voice of the customer. Define the key elements which would boost the project. At last, do an outline using SIPOC – high-level process mapping.
- Measure – During the Measure phase of the project, measurement of collected data (By Sampling) of ongoing processes need to be done with intent to meet the goal. Measurement system analysis (MSA) method is applicable here. Then determine the Process Capability.
- Analyze – On this phase, we need to determine the possible causes of variations and defects by performing Root Cause Analysis. We would use hypothesis testing and Design of Experiment.
- Improvement – After knowing the possible causes of variation, we would move to Improvement phase. Here, we would implement the Improvement methods by doing pilot study and conduct FMEA.
- Control – This is the final phase of DMAIC methodology. Here, we monitor the process for continuous improvement by implementing Statistical Process Control. Prepare documentation of the whole implementation for reference to improve continuously.
- Voice of customer (VOC) – It is a term used to describe customer expectations or say experience with the products or services. It captures the customer’s wants and reviews – “What are the requirement and expectation of a customer?” and “What was his/her experience with that particular products or services?” Now, to collect data we could use methods like surveys, interviews, observations, feedbacks and so forth. It plays an important role in manufacturing and non-manufacturing scenarios by providing a clear cut view of Customer perspectives.
- SIPOC – It is a high level mapping which gives the overview of initial inputs to the final outputs of a process. It stands for
- Supplier – Those who supply the inputs in a process.
- Input – Resources that are added to a process by the Suppliers.
- Process – A set of steps required to convert Input to Output.
- Output – Resultant or outcome of a process.
- Customer – Those who receives an output (Product or service) of a process.
- Sampling – It is a method used in statistical analysis of a data where a specific number of samples are taken from a population for a study. In the case of an infinite population, it is not possible to do on the whole population. In such cases, a sample study is the only applicable method. For e.g. a manufacturer industry wants to check the quality of a product. It is not possible to check on each and every item is manufactured. So we will take some part of it for inspecting the quality.
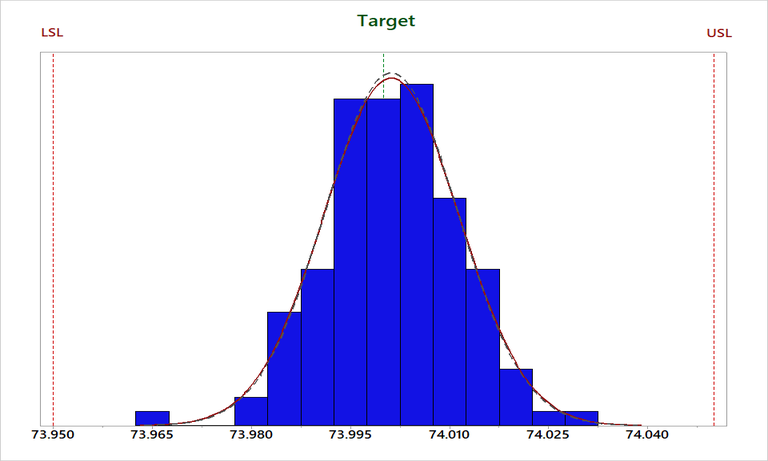
- Process Capability – Suppose in a manufacturing process or any process, we often required information about the process w.r.t its performance or capability. Basically, it refers to the capability of a process to meet customer requirements or industrial standards on a consistent basis. It can be measured by Cp and Cpk.
- Cp – It is often described as the capability of a process when the process data is centred and specification limits are known.
- Cpk – It is described as the capability of a process when the process data is not centred and only one of the specification limits are known.
- Root Cause Analysis – It is a technique which helps to find the root causes of a problem and then we could overcome by implementing control plan for it. Key tool which is used in such type of analysis –
- Fishbone Diagram (Ishikawa diagram) – It was introduced by Kaoru Ishikawa to display graphically all the causes occurred during the process variation in a quality improvement plan. Common purpose to use this diagram is for product design specification and to prevent further quality defects. Here the causes are categorized into various forms and so it will be helpful to identify the source of variation easily.
- Hypothesis Testing – Suppose we got just a sample data from the population. Based on the sample data, we need to make an inference for a population. For example, a manufacturer wants to check the product’s quality meets the pre-specified criteria. Basically, it draws an inference about the sample data w.r.t to population parameters.
- Failure Mode Effect Analysis (FMEA) – It helps to identify problems that may arise using the improved process. Failure modes are the way in which a process can fail. Effects are the impact on a process as a result of failure. It evaluates the severity, occurrence and detection of risks in a process. There are two types of FMEA.
- DFMEA (Design Failure Mode Effect Analysis) – It finds out the product malfunctions, safety and regulated concerns arise from design parameters like tolerances limits, material and so on.
- PFMEA (Process Failure Mode Effect Analysis) – It explores the factors which impacts process quality arises from 6 Ms (Men, Methods, Material, Machine, Measurement and Mother Nature).
It was introduced by Kaoru Ishikawa (renowned Japanese Professor). He pioneered quality control activities in Japan. With the usage of these basic tools, 95% of variation could be eliminated from a process.
- Check sheet – It is a form of the document for organizing and collecting data in real time process or in a location where the data is generated. It helps us to understand the process & to keep track of defect patterns including the causes.
- Pareto chart – It is a special type of chart which combines both bar graph and a line graph to represent the factors which are affecting the variable. Highlights the most frequently occurring defects & used to determine priorities for quality improvement.
- Histogram – It is a pictorial representation which displays the data value in bars. It gives an easy understanding of a process line.
- Scatterplot – It is a simple graph where the data of two continuous variables are plotted against each other. It helps to identify the strength of the relationship between two factors & their cause and effect relationship.
- Cause and effect diagram – Also popularly known as Fishbone diagram. It is a tool to explore the causes and to display as many as possible causes that might be creating a problem.
- Control Chart – It is a graph which displays all the process data in order sequence and detects variation in a process. It prevents us from manufacturing defective product.
- Stratification – It is a method to divide the data into categories or groups (homogeneous kind). It helps to identify the source of variation from which categories of data and reduction in sampling error.