- Minitab
- Oct 05
What are the Quality Tools Available in Minitab?
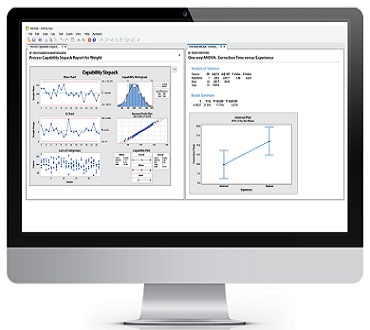
The term Quality generally defined as “fitness for intended use”. It plays an important role in organisational excellence. Improving quality has become a top priority in an organisation, whether in discrete, process manufacturing or service industry – achieving customer satisfaction is the highest level of quality. So, we should apply techniques which can help to gain detailed insights into customer requirements and ability to provide services or products to meet or exceed their expectations.
Minitab offers several quality tools to help you explore and detect quality problems and improve your process in an objective, quantitative way. To improve quality, our common goals should include reducing defect rates, manufacturing products within specifications, standardizing delivery time and so on.
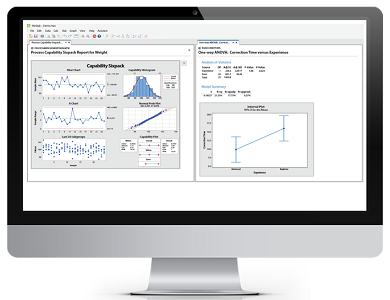
We will discuss a few of the quality tools which are available on MINITAB.
- Pareto Chart
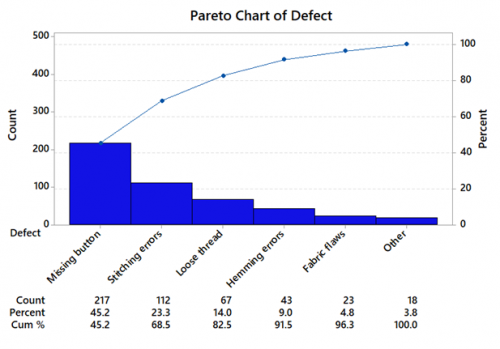
It helps us to identify process problems which are most common by plotting the frequencies and corresponding percentages of a categorical variable. We can use a Pareto chart to identify the most frequent defects, the most common causes of defects, or the most frequent causes of customer complaints. The very purpose of this chart is to highlight the most important among a set of factors which is affecting the process so that we can solemnly focus, improvement efforts on areas where the quality improvement can be made to great extent.
- Reference
An inspector of a clothing manufacturer investigates sources of clothing defects to prioritize improvement in a process. So, he creates a Pareto chart to tracks the number and type of defects in the process.
- Cause-and-effect (Fishbone) Diagram
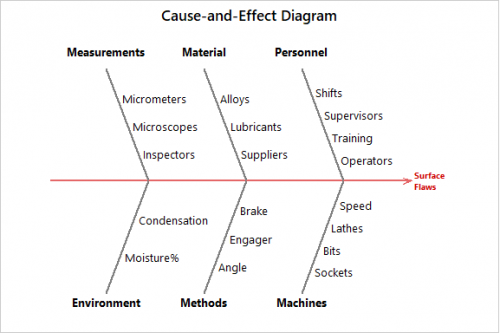
It helps us to brainstorm potential causes of a problem and visualize relationships between a problem and potential causes. Sometimes we know there is a variation in a process but we don’t know what the root cause of it. So, for this very purpose, we can create a Fishbone diagram and compare the correlative importance of different causes. This diagram can be used in any type of industry whether it can be manufacturing, service, medical research and so on. We can also customize the categories of causes according to our requirements.
- Reference
In a manufacturing plant, a quality inspector wants to find out the causes behind the surface flaws of a product. It resulted in the rejection of products. He creates a fishbone diagram to know the possible causes and to implement the corrective action for it.
- Process Capability Analysis
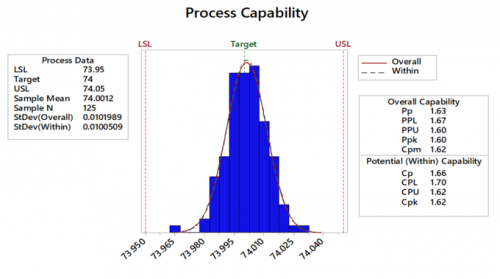
It helps us to understand whether our process is capable or not of meeting required specifications and provides insights into how we can improve a poor process. To perform the process capability analysis, we must mention specification limits (lower, upper or both) and compare the spread of the process variation to the range of the specification limits. When a process is capable, the process spread lies within the specification spread. It also indicates whether the process is on target or not.
- Reference
In a piston manufacturing industry, quality engineers want to assess the process capability. They collect 25 subgroups of five piston rings and measure the diameters. The specification limits for piston ring diameter are 74.0 mm ± 0.05 mm.
All the measurements are within the specification limits. The process is on target and the measurements are approximately centred between the specification limits.
- Measurement system analysis (MSA)
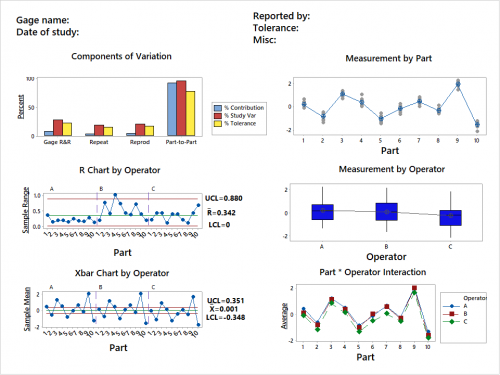
MSA helps us to find variation due to measurement system itself and guide us to evaluate the consistency and accuracy of operators. A Measurement System Analysis is a critical component for any quality improvement process. So, it is always the first priority to evaluate measurement system before using control charts, capability analysis, design of experiment, or other analyses, to prove that the measurement system of the process is accurate and precise. And hence we can clarify that the data are reliable for making a decision.
- We use Gage Study for continuous data.
- We use Attribute Agreement Analysis for attribute data.
- Reference
In the manufacturing industry, an engineer selects 10 parts that represent the expected range of the process variation. Three operators measure the 10 parts, three times per part, in random order. By using MINITAB, he performs a crossed gage R&R study to assess the variability in measurements that may be from the measurement system.
- Acceptance Sampling
It helps us to evaluate the quality of incoming or outgoing products, based on certain quality characteristics. Acceptance Sampling is an alternative to 100% inspection and is a major component of the quality control process. Here, inspection is performed on a lot or batch of parts or products. We can use acceptance sampling to accept or reject a lot based on a representative sample.
There are two methods of Acceptance Sampling – Attribute and Variable Sampling Plan.
You might be thinking, which method is applicable for your process: Attribute sampling plan or Variable sampling plan?
To know more about the Acceptance Sampling, please check our blog titled “How to Decide Whether to Accept or Reject the lot in Manufacturing Scenarios?”
These are the few tools; we have discussed and to know more about the other quality tools – you may download a free trial version of Minitab.
With Recent Release, Minitab now Available on both Desktop and the Cloud.
NB – Want to learn, How to use & explore Quality Tools Available in Minitab Software? Attend our Minitab Certified Training Program, starting from basic to advanced level. Some of the Minitab software training certified courses are Minitab Essentials, Statistical Tools for Pharmaceuticals, Statistical Quality Analysis & Factorial Designs, etc. Apart from Minitab training, we also conduct basic and advanced Statistical training. Some of the Statistical training certified courses are Predictive Analytics Masterclass, Essential Statistics For Business Analytics, SPC Masterclass, DOE Masterclass, etc.
We also provide wide-ranging solutions for Enterprise Quality Management to achieve Organisational Excellence.
Related Posts

Why Choose Minitab as your Statistical Data Analytics Software?
Since we are living in a data-driven society, where data analytics have taken centre stage in recent years. Data…
- Aug 06

How to Improve Manufacturing Quality by using Minitab?
Quality is the common terminology which has become one of the most important customer decision factors….
- Jul 08
Categories
Recent Posts
- What role do t-tests play in Pharmaceutical Processes? When can we apply it?
- How Data Science can help to Improve the present Healthcare Scenarios?
- What can we Discover from the Process Data by Creating a Simple Histogram?
- What are the Quality Tools Available in Minitab?
- Why Choose Minitab as your Statistical Data Analytics Software?