- Manufacturing
- Feb 08
How Statistics Applications can add value to the Industrial Manufacturing?
A brief illustration of the Applications of Statistical Methods in the Manufacturing Industry.
Statistics, we heard a lot about it right! In this data-centric world, the importance of statistics is well known in all the areas. It holds a key position in general manufacturing, healthcare, finance, pharmaceutical, automotive and so forth. With the expertise of modern Statistical Data Analytics Software, we can do statistical data computations in seconds.
The main agenda of this blog is to illustrate its application in Industrial Manufacturing. Manufacturing has emerged as one of the highest growth sectors in terms of market size, investments and coverage. It comprises of apparel, chemical, automobiles, electronics, aeronautical, electrical, textile, food, etc.
By applying statistics, we can present data in a simpler form and make a data-driven decision. There are many business benefits of statistics, such as process efficiency & productivity, better decision support systems, quality excellence, predict your business outcomes, and many more. Moreover, statistics is the base level knowledge required in all the Data Science disciplines (Business Analytics, Predictive Analytics, Machine Learning).
Now, let’s discuss a few of the popular statistical methods used in the Manufacturing Industry.

- Hypothesis Testing
We often do Sampling in a process, now you must be thinking “How sampling is related to hypothesis testing?” To draw inference or conclusion about the sample data w.r.t the population as a whole, we use hypothesis testing. There are different methods used in hypothesis testing based on sample, such as one-sample t-test, two-sample t-test, ANOVA, etc. To know more, you may visit our page “Hypothesis Testing’’.
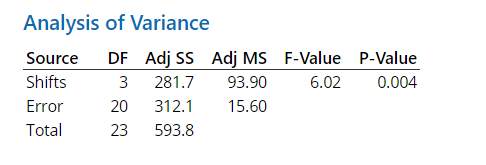
Suppose in a battery manufacturing industry, a quality inspector wants to compare the performance of batteries manufactured in different shifts. So, what he will do? He will collect a sample from different shifts and perform Hypothesis Testing. Here he will use the concept of ANOVA (Analysis of Variance).
To read more about ANOVA, you may check our blog titled “Understand the Applications of ANOVA in Manufacturing Process!”.
- Reference
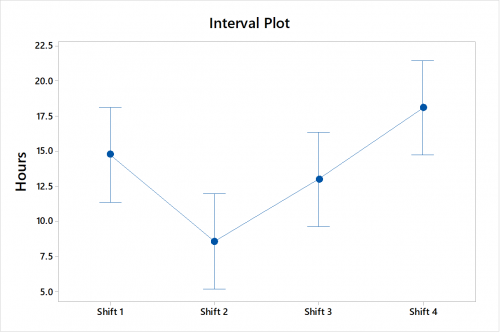
There are four different shifts – Shift 1, Shift 2, Shift 3 and Shift 4. Since our p-value is 0.004 (From ANOVA Table) which is less than our alpha value 0.05, we can conclude that the means are significantly different from each other. Similarly, on an interval plot, we can see the mean differences between each shift.
- Measurement System Analysis (MSA)
We collect data for analysis and draw some conclusion from it. Now the question is “How much we are sure that the data we collected is reliable enough for analysis?” MSA helps us to find variation in the data we collected from a measurement system and guide us to improve the system for measurement. Measurement System Analysis has different methods based on the types of data, for continuous data – Gage R&R Analysis and for attribute data – Attribute Agreement Analysis.
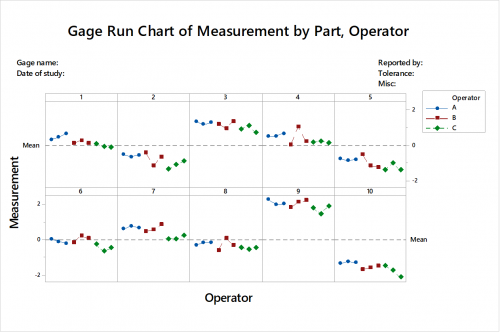
Suppose in a piston manufacturing company, operators use callipers to measure the diameter of the piston. Now in this scenario, “Are we 100% sure that the collected data is measured correctly or not?” To overcome it, we will use Measurement System Analysis. Thus, it is always the first priority to evaluate measurement system before conducting any kind of analysis. We will create a simple Gage Run Chart to examine the differences in their measurement.
- Reference
Three operators measure 10 pistons, three times per piston randomly. Here, we can examine the differences in measurements between operators. We can see that Operator B does not measure consistently, and Operator C usually measures lower than the other operators.
- Statistical Process Control (SPC)
We want to know whether our process is statistically under control or out of control. And further, we want to evaluate whether our process is capable to meet our client requirement or not. How to examine it? Here, Statistical Process Control (SPC) comes into play which is a tool through which we can control, monitor and improve the process. It is used to track variation and eliminate it from a process. It is widely used in almost all manufacturing processes for process stability and continuous improvements.
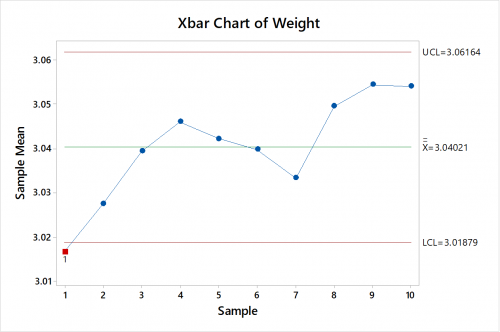
Suppose a glass manufacturer wants to determine whether the production process for a new product is in control. They collect subgroups of 10 units every hour for 10 hours and assess the thickness of glass by plotting in a Control Chart.
- Reference
One point is out-of-control on the X-bar chart. We can conclude that the process is not in control and should be improved. We can do brainstorming to find the root cause of a problem.
- Design of Experiment (DOE)
The terms like robustness and optimization are at peak in manufacturing processes. How to achieve it? Simple, by conducting the design of experiment or popularly known as DOE. It provides a quick and effective method for optimizing products or processes. It plays a major role in new product design & formulation, process development and improvement.
Suppose in a simple manufacturing process – we need input variables (raw materials) which ultimately change into the product at the end of a process. There are various noise factors which could affect the process such as temperature, changes in raw material, part variations, power fluctuation, etc. To get the robust process and optimize response value, we apply DOE on it.
- Reference
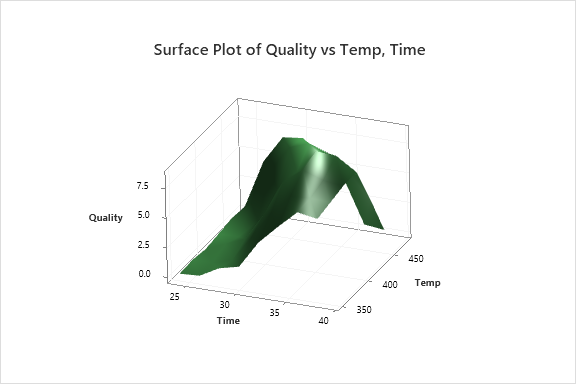
After creating, data collection and analysing the DOE Design, we have created a Surface Plot to understand visually. To achieve good quality, the optimal settings should be between 400° and 450° and duration between approximately 30 and 36 minutes.
We have discussed a few of the statistical methods which are popularly used in the manufacturing industry. This small post can’t cover all the statistical methods used in the industry. But at least, we got a glimpse of it.
Statistics has emerged as one of the basic foundational skill needed in data science and applications. Most of the advanced statistical methods are used for quality improvement and organisational excellence.
NB – Want to learn the concepts of Statistics and Application in Industries? Attend our Statistical Training Program starting from basic to advanced level. Some of the Statistical training certified courses are Predictive Analytics Masterclass, Essential Statistics For Business Analytics, SPC Masterclass, DOE Masterclass, etc. Apart from Statistical training, we also conduct Minitab Certified Training Program, starting from basic to advanced level. Some of the Minitab software training certified courses are Minitab Essentials, Statistical Tools for Pharmaceuticals, Statistical Quality Analysis & Factorial Designs, etc.
We also provide a wide range of Business Analytics Solutions and Business Consulting Services for Organisations to make data-driven decisions and thus enhance their decision support systems.
Related Posts
What can we Discover from the Process Data by Creating a Simple Histogram?
A simple demonstration of Histogram usage in your process! Histogram is commonly used for graphical….
- Oct 05

Is your Sample Size enough for doing the Analysis?
I guess this is an important question we should ask ourselves before doing any kind of analysis. We should…
- Jul 06
Categories
Recent Posts
- What role do t-tests play in Pharmaceutical Processes? When can we apply it?
- How Data Science can help to Improve the present Healthcare Scenarios?
- What can we Discover from the Process Data by Creating a Simple Histogram?
- What are the Quality Tools Available in Minitab?
- Why Choose Minitab as your Statistical Data Analytics Software?