
The origin of statistics was laid in the 16th century with the onset of probability by Girolamo Cardano. Later its mathematical foundations were laid in the 17th century with the development of the probability theory by Blaise Pascal and Pierre de Fermat.
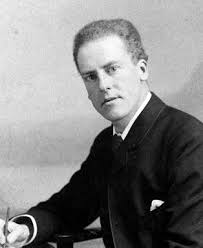
The modern field of statistics emerged in the late 19th and early 20th century. It was led by the work of Francis Galton and Karl Pearson, who transformed statistics into mathematical terminology used for analysis in science, industry and politics.
Karl Pearson developed some of the central techniques of modern statistics. In the early 1900’s Pearson became interested in the work of Francis Galton, who wanted to find statistical relationships to explain how biological characteristics were passed down through generations. Pearson’s research laid much of the foundation for 20th century statistics, defining the meanings of correlation, regression analysis and standard deviation.
He founded the Department of Applied Statistics at University College London in 1911; it was the first university statistics department in the world.
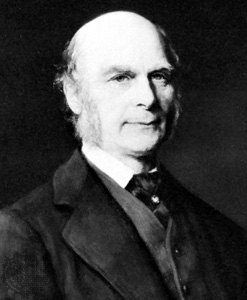
Francis Galton is credited as one of the principal founders of statistical theory. His contributions included introducing the concepts of standard deviation, correlation, regression analysis and the application of these methods to the study of the variety of human characteristics – height, weight, among others. He found that many of these could be fitted to a normal curve distribution.
The mathematical statistics was pioneered by Ronald Fisher who wrote two textbooks – “Statistical Methods for Research Workers” published in 1925 and “The Design of Experiments” in 1935. This involved the development of better design of experiments models, hypothesis testing and techniques for use with small data samples.
Nowadays, statistical methods are applicable in all areas which involve Prediction Management, Decision Making, for making good inferences from a data and so on. Statistics has been relied mostly on statistical software to produce tests such as descriptive and inferential statistics.
Images – Referred from commons.wikimedia.org
Statistics present facts in simple form, reduce the complexity of data, facilities comparison, helps in forecasting and to draw the inference. Collection of data is the first step among the statistical methods. Internal data are collected from within the organization whereas external data are collected from outside. External data are again of two types – Primary Data and Secondary Data. Primary data are data collected from first-hand sources. Secondary data are data collected from secondary sources.
It can be of two major categories – Descriptive and Inferential Statistics.
- Descriptive statistics are used to organize and describe the characteristics of a collection of data. The collection is sometimes called a data set or just data. The purpose of descriptive statistics is to summarize or display data so we can quickly obtain an overview.
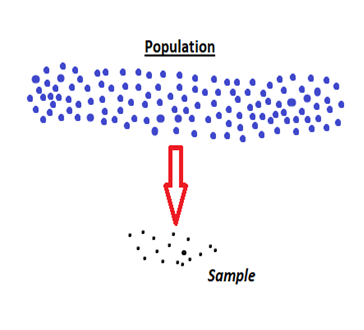
- Inferential statistics are often the next step after we have collected and summarized data. Inferential statistics are used to make inferences based on a smaller group of data (sample) about a large set of data (population).
And today, knowledge of statistics is more important than ever because it provides us with the tools to make decisions that are based on observed evidence and not our own biases or beliefs. Statistics deals with all aspects of data including the planning of data collection in terms of the design of surveys and experiments.
Data are the actual pieces of information that we collect through our process. Different types of data can be collected for different purposes. Datum is a singular form and Data is a plural form.
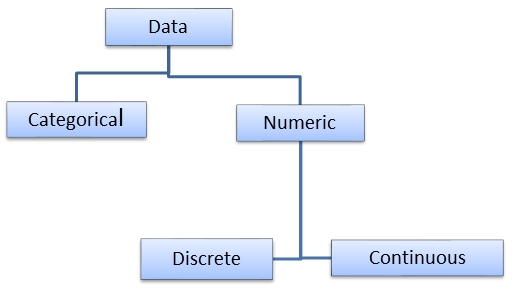
There are different types of data and can be classified majorly in categorical and numerical data.
- Categorical data: It represents characteristics of a data which is defined in categories or groups. Data here are not numerical in nature and hence known as qualitative data. For example, male or female, accept or reject, pass or fail, etc.
- Numeric data: It is a type of data which is numerical in nature and known as quantitative data. It can be further classified into discrete and continuous data.
- Discrete data is a data which take only certain values. It can’t be measured but it can be counted and has a whole number. For e.g. machines, people, etc.
- Continuous data is a data which can take any values either fractional or decimal. For e.g. weight of a machines, height of sheets, temperature of a room, etc.
Statistics is a method of collecting, presenting, analyzing, deriving valid conclusions and making reasonable decisions from the data collected. There are four common stages in statistics which are applicable in all the disciplines.
- Collection of Data – It is the initial stage and this is the foundation upon which the entire data set. Careful planning is essential before collecting the data. One of the important methods for collection of data is through sampling. Apart from sampling, we can collect data through primary and secondary sources.
- Presentation of data – The data collected should be presented in a suitable, concise form for further analysis. Here we use a tabular form or a graphical representation such as frequency distribution, Pareto chart, histogram, control chart, etc. This gives the overview of data and helps to understand the data in easier way.
- Data Analysis – The data presented should be carefully analyzed for making inference and we use descriptive statistics such as measures of central tendencies, correlation, regression, etc. We should have the basic foundation of descriptive statistics.
- Drawing inference – The final step is to draw inference or to make conclusions. There are different approaches for drawing inferences depending on problem. But commonly we use inferential statistics such as testing of hypotheses, ANOVA, DOE, etc.
Sampling plays an important role in the field of statistics and we should know the basic concept of it. Sampling is a method used in statistical analysis of a data where a specific number of samples are taken from a population for a study. In the case of an infinite population, it is not possible to do on the whole population. In such cases, a sample study is the only applicable method. For e.g. a manufacturer industry wants to check the quality of a product. It is not possible to check on each and every item is manufactured. So we will take some part of it for inspecting the quality.
There are different techniques of sampling used for different purposes. Some are simple random, stratified random and systematic sampling.
- Simple random sampling is a procedure of drawing a sample in such a way where every unit has an equal chance of being included in the sample.
- In stratified random sampling, the population is divided into a number of subgroups or strata and from each stratum, a simple random sample may be selected to form the required sample from the population.
- Systematic sampling is a procedure of drawing a sample in systematic way. It is obtained by selecting every Kth individual from the population.
Statistics can be applied to every sphere of human activity and it has a wide range of applications. It is almost impossible to find a single department of human activity where statistics cannot be applied. Such as applied statistics, statistical computing, reliability engineering and so on. Common applications are as follows

- Statistics in the manufacturing industry – It is widely used in many industries. It can be applied to check the product quality, process performance, conforming specifications, etc. Statistical quality control is used to check whether the process is meeting specific control limits or not and whether the product manufactures is of good quality or not.
- Statistics in the medical field – It can be used in different phases like testing of drugs, clinical trials and so on. Sample tests such as T – test and Z – test are used to compare the efficiency of drugs and many medical practices.
- Statistics enhanced with software – Due to the advancement of computer science and technology, we can use many software packages for statistical analysis. One of the trending application is MINITAB software. It supports many statistical techniques like statistical quality control for quality improvement, clinical trials for pharmaceuticals, the design of experiments, etc.
- Machine learning & data mining – Statistics is the base of all data mining and machine learning algorithms. Its applications are data management and data analysis. Statistical tools are required for data analysis. Some of the popular techniques used are sampling, correlation, regression, hypotheses testing, etc.
- Enterprise Quality Management
- Enterprise Decisions Management
- Enterprise RISK Management